Table of Contents
Overview
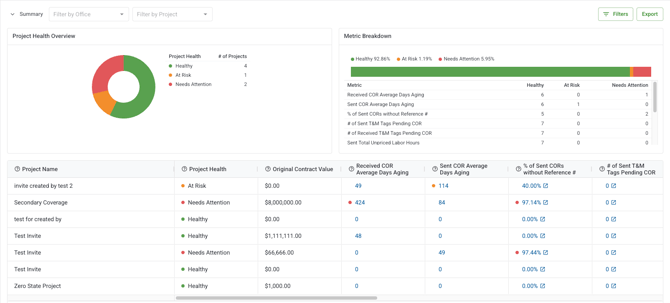
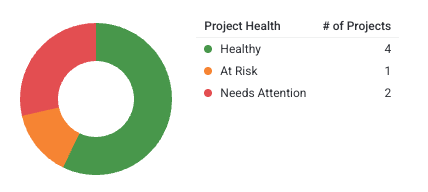
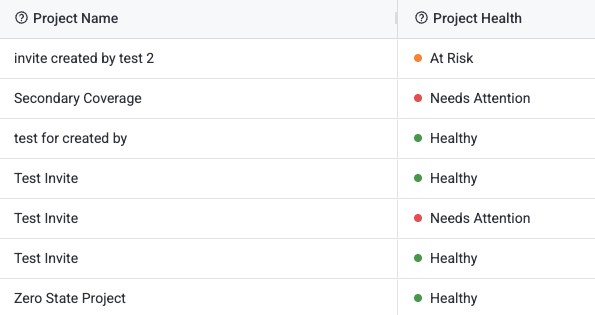
The Roll-Up Report gives executives, admins, and project managers a single place to assess portfolio health without opening individual projects. Each row in the report represents a project, and each column represents a health metric — such as average days aging, outstanding COR value, or unpriced labor hours. Each metric cell shows a calculated value alongside a color-coded health indicator that tells you at a glance whether that project is Healthy, At Risk, or needs Attention.
The report is fully configurable. Account Owners choose which metrics appear, set the thresholds that define each health state, and can apply pre-built presets designed for GC or SC executives to get started immediately.
What you see depends on your role. Account Owners and Admins see all projects they have access to. Project Managers see only their assigned projects. Field Users do not have access to the Roll-Up Report.
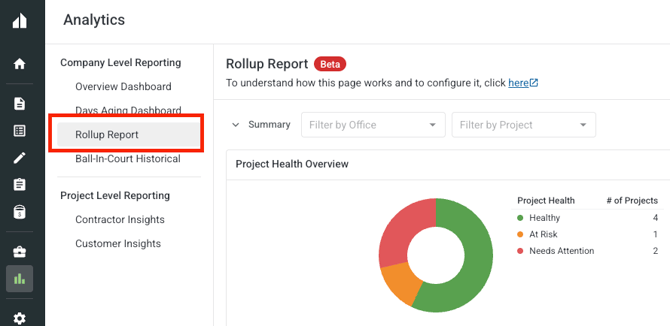
You can access the Roll-Up Report from the Analytics section of the Clearstory side panel.
Why it matters
Without the Roll-Up Report, understanding portfolio health means navigating into each project one at a time and piecing together COR status, aging, and T&M exposure manually. The Roll-Up Report does that aggregation for you and adds a health scoring layer — so you can spot which projects need attention in seconds rather than hours.
How it works
The Roll-Up Report is a configurable data table. Each project appears as a row. Each column is a metric chosen by your Account Owner from a library of 16 options across Change Orders, T&M Tags, and Change Notifications.
Health indicators appear in each metric cell alongside the calculated value. There are three states:
-
Healthy — the metric is within acceptable thresholds
-
At Risk — the metric is approaching a concern level
-
Attention Needed — the metric has exceeded the threshold and requires action
Health thresholds are set per metric by the Account Owner and can be customized to match your company's standards.
Available metrics are grouped into three categories:
Change Orders — Sent and Received COR Average Days Aging, % of CORs without a Reference #, and $ of CORs In Review.
T&M Tags — Sent and Received T&M Tags Pending COR, Total Unpriced Labor Hours, and T&M Tags Awaiting Signature.
Change Notifications — Sent and Received CNs Awaiting Responses, and CNs Past Response Due Date.
Step-by-step instructions
Navigate to the Roll-Up Report
-
Open Clearstory and go to the Analytics section in the side panel.
-
Select Roll-Up Report from the Analytics navigation.
-
The report loads automatically and displays the columns and thresholds configured for your company.
Note: If no columns have been configured yet, the report will appear empty. An Account Owner needs to set up the report in Settings before other users can see data.
Configure columns and column order (Account Owners only)
You can manually choose which metrics appear in the Roll-Up Report and arrange them in the order that makes the most sense for your team.
-
Go to Settings and open Roll-Up Report Settings.
-
Open the Format Tab and click Edit.
-
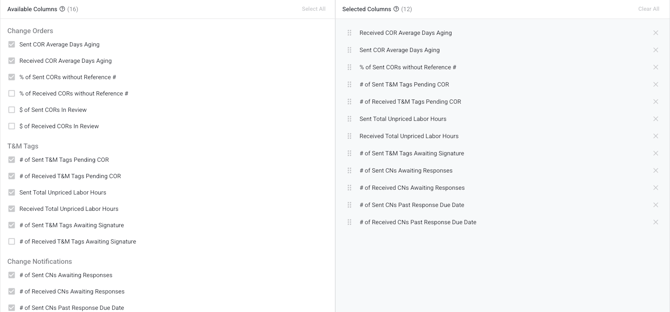
In the Available Columns section, select the metrics you want to include. You can choose up to 16 metrics across Change Orders, T&M Tags, and Change Notifications.
-
In the Selected Column Order section, drag and drop columns to set the sequence.
-
Click Save. The Roll-Up Report updates immediately to reflect your changes.
Configure health thresholds (Account Owners only)
Each metric has its own threshold settings that define what counts as Healthy, At Risk, or Attention Needed. You can customize these thresholds per metric to match your company's standards.
-
Go to Settings and open Roll-Up Report Settings.
-
Open the Format Tab and click Edit.
-
Find the metric you want to configure in the Available Columns section and click Configure.
-
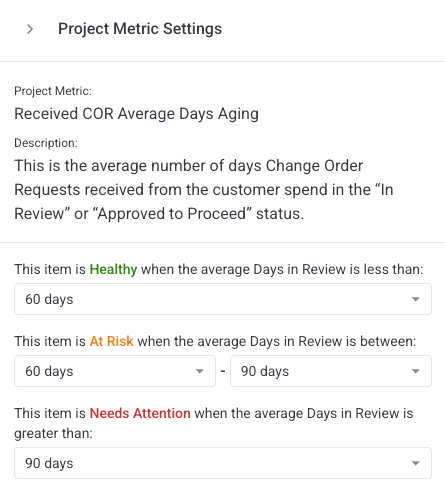
In the Project Metric Settings panel, set the threshold values for each health state.
-
Click Update. Health indicators in the Roll-Up Report update immediately to reflect the new thresholds.
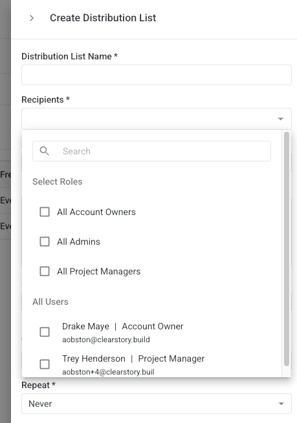
Set up automated delivery (Account Owners only)
The Roll-Up Report can be automatically delivered to internal team members or external stakeholders on a recurring schedule — no login required for recipients.
-
Go to Settings and open Roll-Up Report Settings.
-
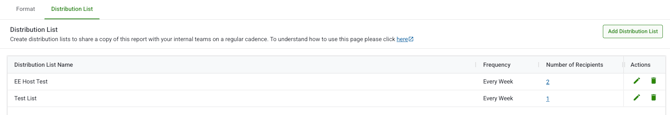
Open the Distribution List Tab.
-
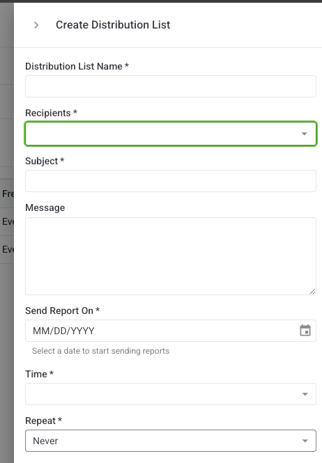
Add recipients by selecting existing Clearstory users or entering external email addresses.
-
Set the delivery frequency: weekly, monthly, or quarterly.
-
Save your distribution settings. Clearstory will automatically send the report at the configured interval.
Recipients can be edited or removed from the distribution list at any time.
Filter the report
You can narrow the Roll-Up Report to a specific set of projects using the filter bar at the top of the page.
-
Open the Roll-Up Report.
-
Use the filter bar to select one or more of the following filters:
-
Project
-
Office
-
Region
-
-
The report table updates in real time to show only the matching projects.
-
To remove a filter, clear it individually or clear all at once.
Note: Active filters are reflected in any exports you generate.
Export the report
You can export the Roll-Up Report to CSV or XLS for use in external presentations, leadership meetings, or progress reviews.
-
Open the Roll-Up Report.
-
Apply any filters you want reflected in the export.
-
Click the Export button.
-
Select CSV or XLS as your export format.
-
Clearstory processes the export in the background. You will receive a notification when your file is ready to download.
Exports include the configured metric columns and reflect any active filters.
What each role can do
|
Action |
Account Owner |
Admin |
Project Manager |
Field User |
|---|---|---|---|---|
|
View Roll-Up Report |
✅ |
✅ |
✅ |
❌ |
|
Filter Roll-Up Report |
✅ |
✅ |
✅ |
❌ |
|
Export (CSV / XLS) |
✅ |
✅ |
✅ |
❌ |
|
Configure columns & order |
✅ |
❌ |
❌ |
❌ |
|
Configure health thresholds |
✅ |
❌ |
❌ |
❌ |
|
Apply presets (GC / SC Executive) |
✅ |
❌ |
❌ |
❌ |
|
Manage distribution list |
✅ |
❌ |
❌ |
❌ |
Tips and best practices
Start with a preset if you're setting up the report for the first time. The GC and SC Executive presets give you a sensible starting configuration in seconds, and you can adjust columns and thresholds from there.
Set thresholds before sharing the report with your team. Health indicators only appear when thresholds are configured. A report without thresholds will show metric values but no color-coded health scoring.
Use the Attention Needed filter to prioritize. After loading the report, sort or scan for projects showing Attention Needed across multiple columns — these are the ones that need the most immediate follow-up.
Filter before exporting. Scoping the report to a specific office or region before exporting gives you a more focused file to share in a meeting or with a specific stakeholder.
Use the distribution list for recurring reviews. If you have a weekly or monthly portfolio review, set up automated delivery so stakeholders receive the report without needing to log in or ask for it.
FAQs
Who can access the Roll-Up Report?
Account Owners, Admins, and Project Managers can view the report. Field Users do not have access.
Why is my Roll-Up Report empty?
The report will appear empty if no columns have been configured by an Account Owner. Go to Settings → Roll-Up Report Settings → Format Tab to select and save your metric columns.
Can I customize the report after applying a preset?
Yes. Presets seed a starting configuration, but all columns and thresholds remain fully editable after a preset is applied.
What happens if I apply a preset and already have a configuration saved?
Clearstory will warn you that applying the preset will overwrite your current column configuration. You need to confirm before the preset is applied.
Why do I see different projects than a colleague?
The report is scoped to each user's role and project access. Account Owners and Admins see all projects in their scope. Project Managers see only the projects they are assigned to.
What do the health indicators mean?
Each metric cell shows a health indicator based on thresholds set by your Account Owner. Healthy means the metric is within acceptable range. At Risk means it's approaching a threshold. Attention Needed means it has exceeded the threshold and the project needs review.
Can I change what the health thresholds are?
Yes, but only Account Owners can configure thresholds. Go to Settings → Roll-Up Report Settings → Format Tab, find the metric you want to adjust, and click Configure.
What metrics can I add to the Roll-Up Report?
There are 16 available metrics across three categories: Change Orders (COR days aging, COR value in review, % missing reference numbers), T&M Tags (tags pending COR, unpriced labor hours, tags awaiting signature), and Change Notifications (CNs awaiting responses, CNs past due date). All metrics are available for both Sent and Received contexts.
Who receives the distributed report?
Anyone added to the distribution list — internal Clearstory users or external email addresses. Recipients receive the report automatically at the configured frequency without needing to log in.
Does the exported file include health indicators?
Exports include the configured metric values and reflect active filters. The export format is CSV or XLS.